Building a Home Lab Control Dashboard
I wanted a simple way to control and monitor some of the devices and services in my home lab from one place, and also the connectivity toward internet. This became a small Home Lab Control dashboard, built as part of the same Flask application that runs this website
The Dashboard
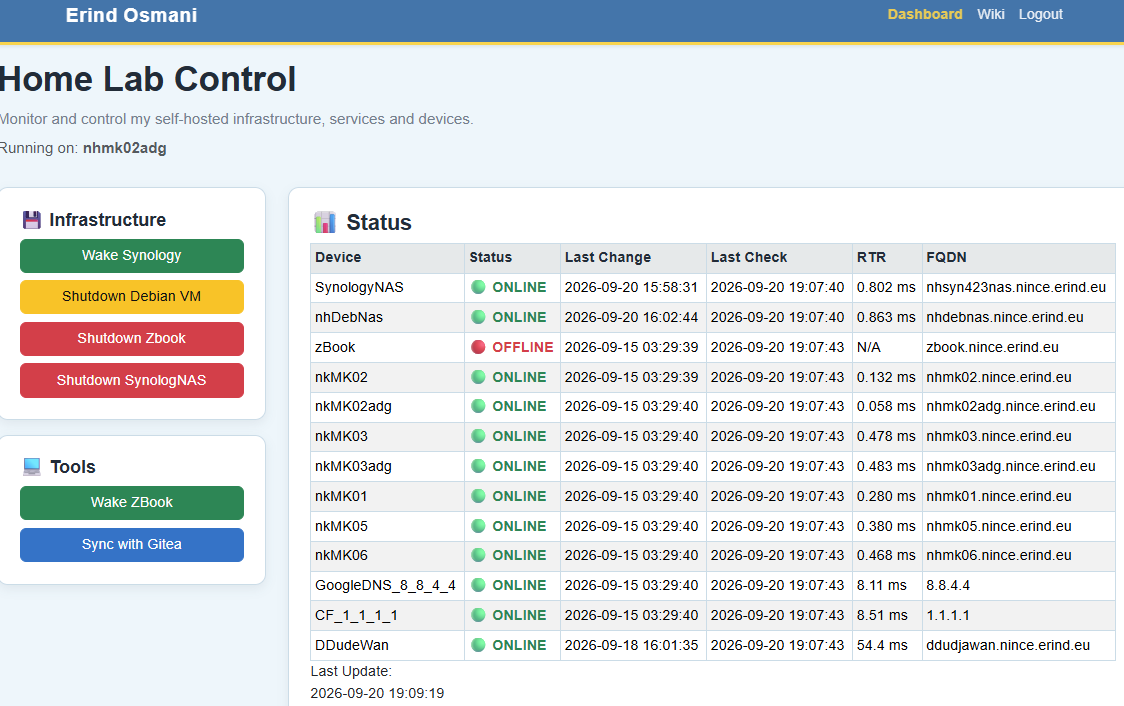
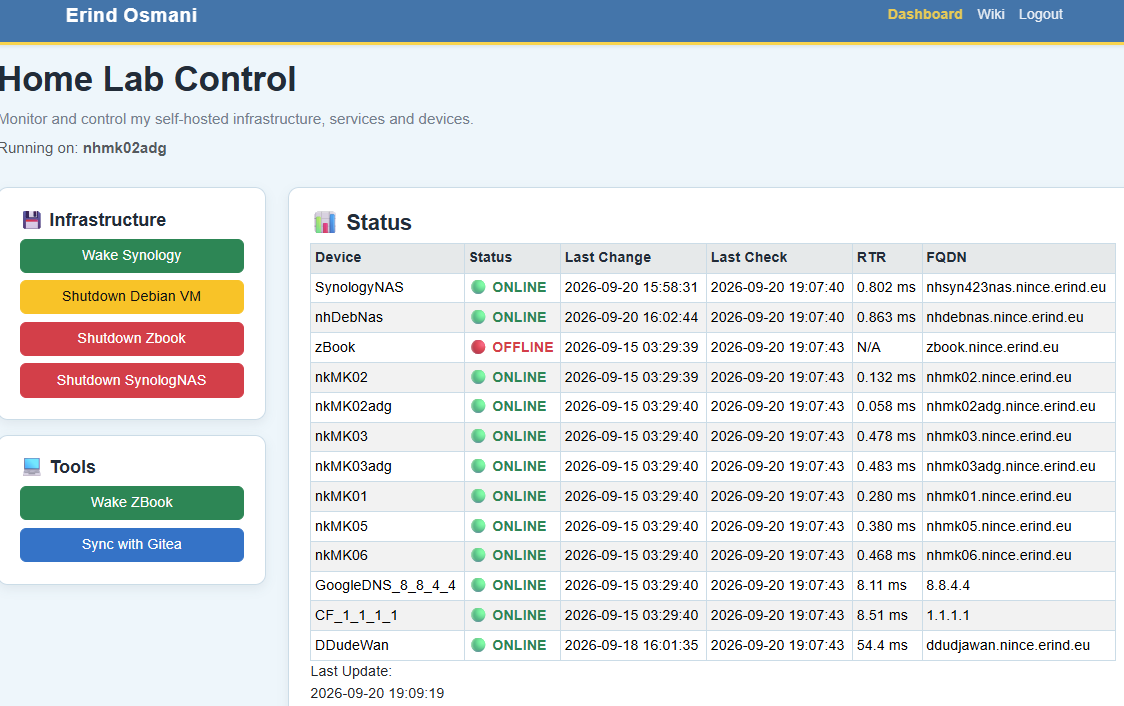
The dashboard gives me a quick overview of my home lab.
From here I can power ON or OFF devices, synchronize with my private Gitea repository, and monitor the status of my infrastructure and internet connectivity.
It monitors devices such as my Synology NAS, Debian systems, ZBook and MikroTik routers. I also monitor external connectivity, for example Cloudflare DNS (1.1.1.1) and Google DNS (8.8.4.4).
The status table shows whether a device is online, when its status last changed, the last check, response time and FQDN.
Why I Built It
I have quite a few devices running in my home lab, but I don't need all of them running 24/7.
For example, my Synology NAS does not need to be powered on when I am not using it. The same applies to some of my other machines. When they are not providing any useful service, there is no reason to keep them running.
I wanted an easy way to power them on when I need them and shut them down again when I am finished.
Instead of doing this manually from different systems, I decided to put these actions into one small dashboard. It also gives me one place to see which devices are currently online.
How It Works
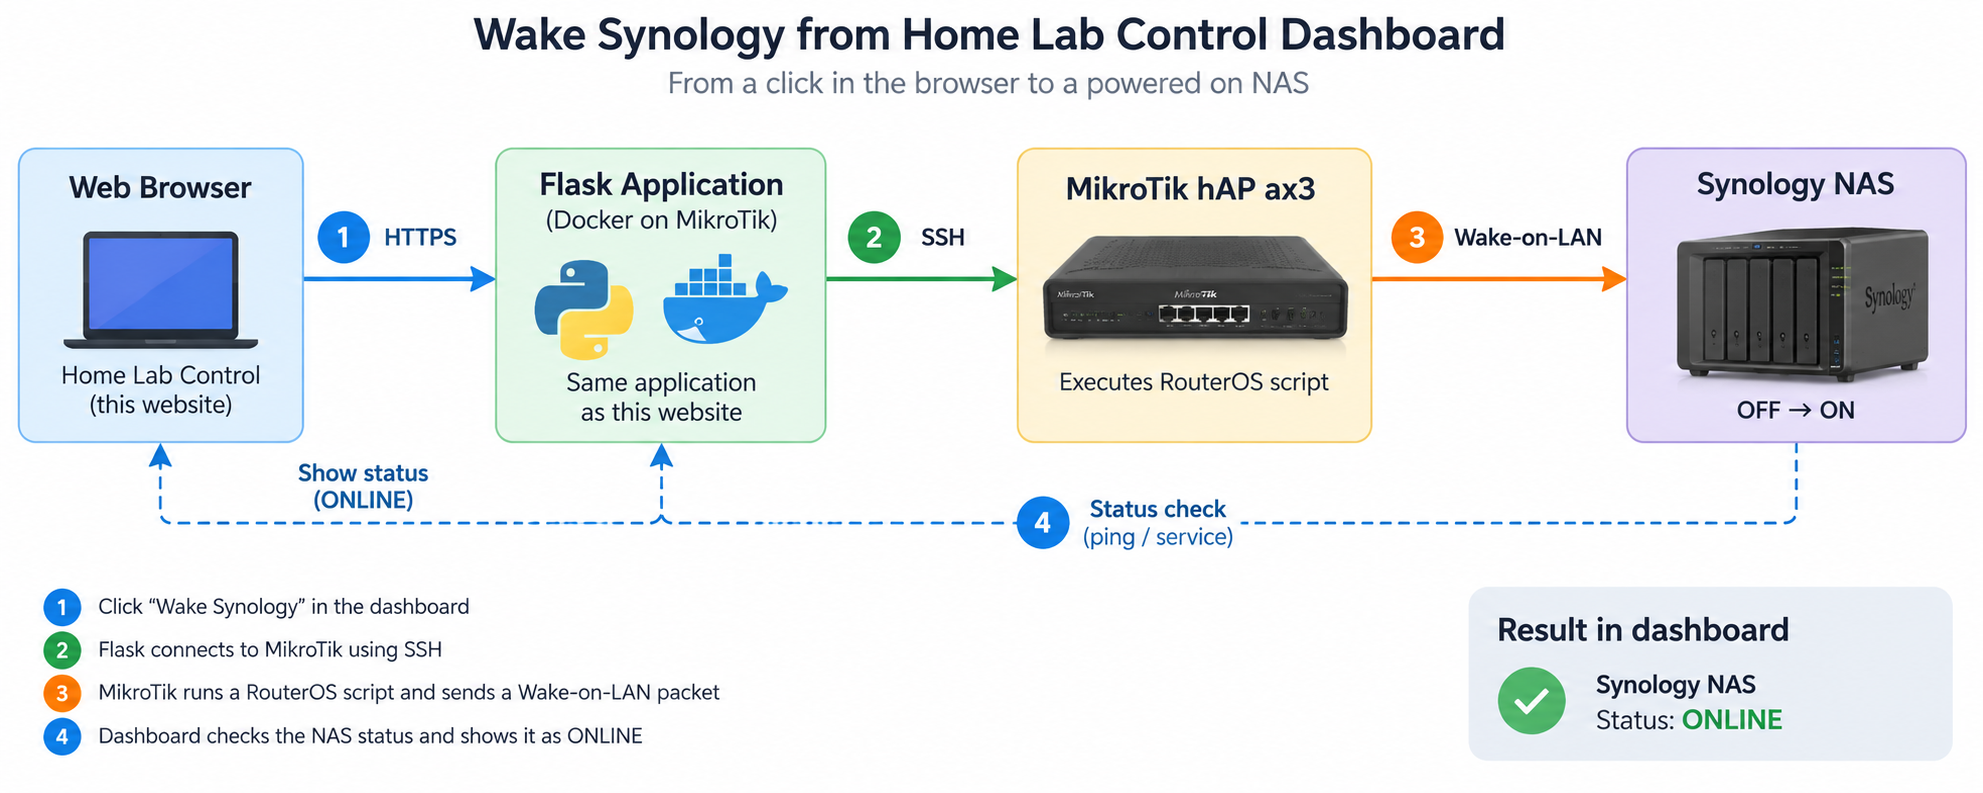
The dashboard is part of the same Flask application that runs this website. Flask is running inside a Debian Docker container on my MikroTik hAP ax3.
When I click Wake Synology, the Debian Docker container running Flask connects to the appropriate MikroTik router over SSH using a public/private key pair. The MikroTik then runs a RouterOS script which sends a Wake-on-LAN packet to the Synology NAS.
I have several MikroTik routers in my home lab, using different network segments. Since the Synology is on a different subnet from the Docker container, the Wake-on-LAN packet cannot simply be sent directly from the container.
Instead, the Docker container connects to the MikroTik that is on the Synology's network, and that MikroTik sends the Wake-on-LAN packet locally.
Once the NAS starts, the dashboard checks its status and shows it as ONLINE.
The engineering flow is:
Browser → Debian Docker / Flask → SSH → appropriate MikroTik → RouterOS script → Wake-on-LAN → Synology
What's Next
The dashboard is still evolving, and I will continue adding functions as I find useful things to automate or monitor in my home lab.